
We’re back with an expanded STI. The overall feedback has been positive, particularly once we’ve explained the general purpose of the STI. Our favourite quote in reaction to last month’s initial effort was that using traffic to measure popularity was like using turds to measure digestion (thanks Metaversed).
Which leads perfectly to a reminder on methodology as well as a couple of disclaimers:
1. The number linked to each presence is a standard average based on dwell statistics provided to all SL users via the Search Places option.
2. For large presences we’ve chosen the most popular area rather than add up total dwell – this means larger presences may have overall larger numbers but that’s not what we’re measuring (see also point 5). Example: The Pond and ABC Island have many different areas – we track the traffic on the most popular area for both those presences.
3. Each presence, unless an addition since the start of the reporting period, has had their traffic stats measured at least ten times with each instance at least 24 hours apart.
4. The individual times and statistics can be found here
5. The STI is indicative only – yes we know there are much more detailed methodologies and that ours is a rough guide only for the SL community – we think of it as a ‘what’s hot’ measure. Discussion / criticism on the STI here.
The July results:
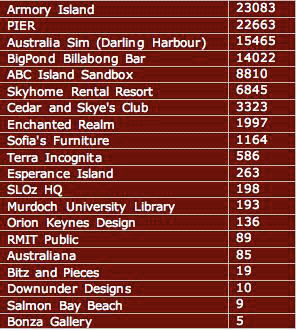
There are a couple of additions to the index, with PIER one of the more popular new ones. The Enchanted Realm traffic is based on one sample only so it’s too early to tell if it’ll maintain its current position. The Billabong Bar and ABC Sandbox retain their appeal and Armory Island’s wall-to-wall gun-toting keeps it in prime position.
If you have a presence in SL that you’d like added to the index, let us know. It just has to be owned / operated by Australians for inclusion. We look forward to any feedback.
[…] we stumbled across The Greenies – the second Traffic Index was published – due to time constraints we haven’t continued this and no-one seems to have […]